


Axes de recherche
- My main background is in Mathematics applied to Statistical/Machine learning.
- I design learning strategies and also provide the theoretical analysis of their statistical performance, with a particular emphasis on scalable approaches in the context of massive data (Big Data).
- Regarding this aspect, a crucial question is understanding the trade-off between the available computational resources and the statistical precision one can achieve.
- Applications from various fields such as biology, industry or cyber-security are also welcome.
Estimator/Model selection
Goal: Choose among several candidate estimators/models the best one.
- Penalized (random) criteria: AIC-or BIC-like penalties
- Regularization (convex relaxation): L1 (Lasso), L2 (Ridge)
- Cross-validation: Leave-one-out, Leave-p-out, V-fold
Two possible perspectives:
- Identification: recover the "true model" (if any)
- Estimation/prediction: recover the model with the smallest generalization error
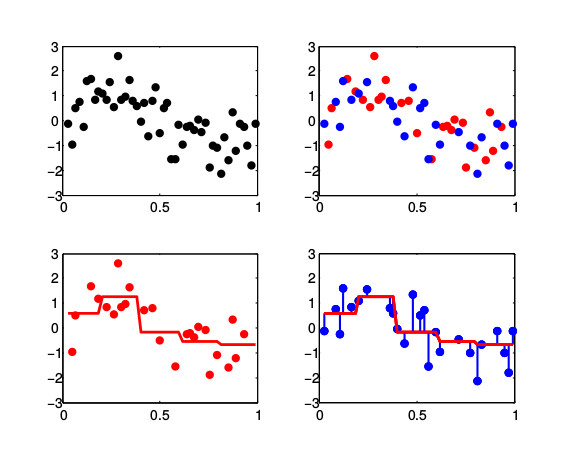
Change-points detection, anomaly/outlier detection
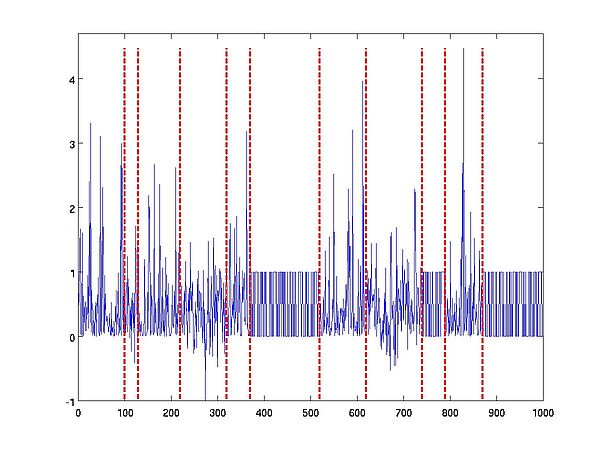
Data: Time-series of "objects" which can be a sequence of high-dimensional measurements from (dependent) sensors, or structured objects such as texts or audio/video streams.
Type of change: Changes in any (prescribed or not) features of the distribution along the time
- Offline: Change-points detection, segmentation
- Online: Outlier detection, anomaly detection
Asset: Does not require any distributional assumption (no parametric model)
Reproducing kernels
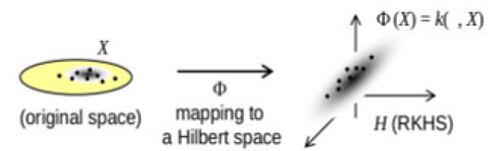
Reproducing kernels, mean embedding, Minimum Mean Discrepancy (MMD), neighboring graph between objects, combination of heterogeneous data of different nature
Rough interpretation:
- Reproducing kernels can be thought of as a "similarily measure" between objects. The more similar a pair of objects, the larger the value of the kernel evaluated at this pair of objects.
Interest:
- Reproducing kernels can deal with objects which are not necessarily vetcors (DNA sequences, graphs, video streams,...).
- As long as such a similarity measure between objects does exist, then these objects can be compared. For instance, a neighboring graph can be built from this pairwise proximity measure.
- Simple combinations of kernels can help combining descriptors (of an individual) although they are of different kinds
Parameter estimation/approximation techniques
Variational algorithm in the Stochastic Block Model (SBM), Low-rank matrix approximation, Random Fourier features, approximate cross-validation
Main interest and difficulty:
- Whereas an estimator can be costly to compute (or even not achievable!), replacing such an estimator by an approximation can greatly reduce the computation time.
- Several approximating strategies often exist. Choosing one of them is usually a difficult task although a large number of them perform well in practice.
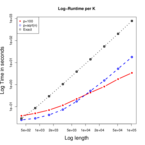
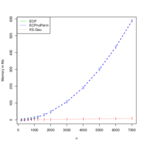
Trade-off between Computation resources and Statistical precision
Motivation:
- Most estimators are defined as minimizers of an optimization problem.
- Optimization algorithms are mainly used to output an (approximate) evaluation
- Numerous optimization algorithms are itertive ones (Gradient descent, Stocastic gradient descent, EM-algorithm, coordinate descent,...)
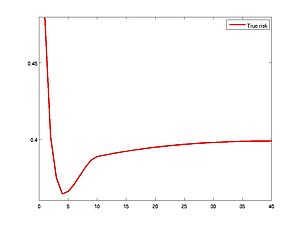
Goal:
- Reducing the computational burden (time and memory), while keeping a reliable statistical performance
- Designing an early stopping rule, that is a data-driven stopping rule indicating when to stop the iterative optimization process
Stability of learning algorithms and concentration inequalities
Strategy:
- Introduce a new notion of stability for learning algorithms
- Exploit connections between this notion of stability and concentration inequalities
- Derive (tighter) concentration results for classical learning algorithms (Ridge regression, k-Nearest Neighbors, Nadaraya-Watson estimators,...)
Applications
- Biostatistics:
- Multiple testing: Identifying genes/SNPs that are differentially expressed between two experimental conditions.
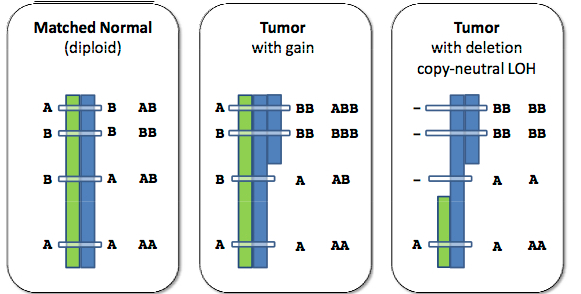
- Change-points detection: Detecting copy number variations along the genome, including variations of the allelic ratio.
- Lasso-like strategies: Supervised selection of features (SNPs for instance) that are related to a disease (cancer) in a high-dimensional context by exploiting the existing between-features redundancy.
- Industry:
In a supervised framework:
- Identifying weak events related to some failures occurrences.
- Designing data-driven rules allowing for detecting weak events online.